
Categories
Vermont Market UpdatesPublished October 9, 2025
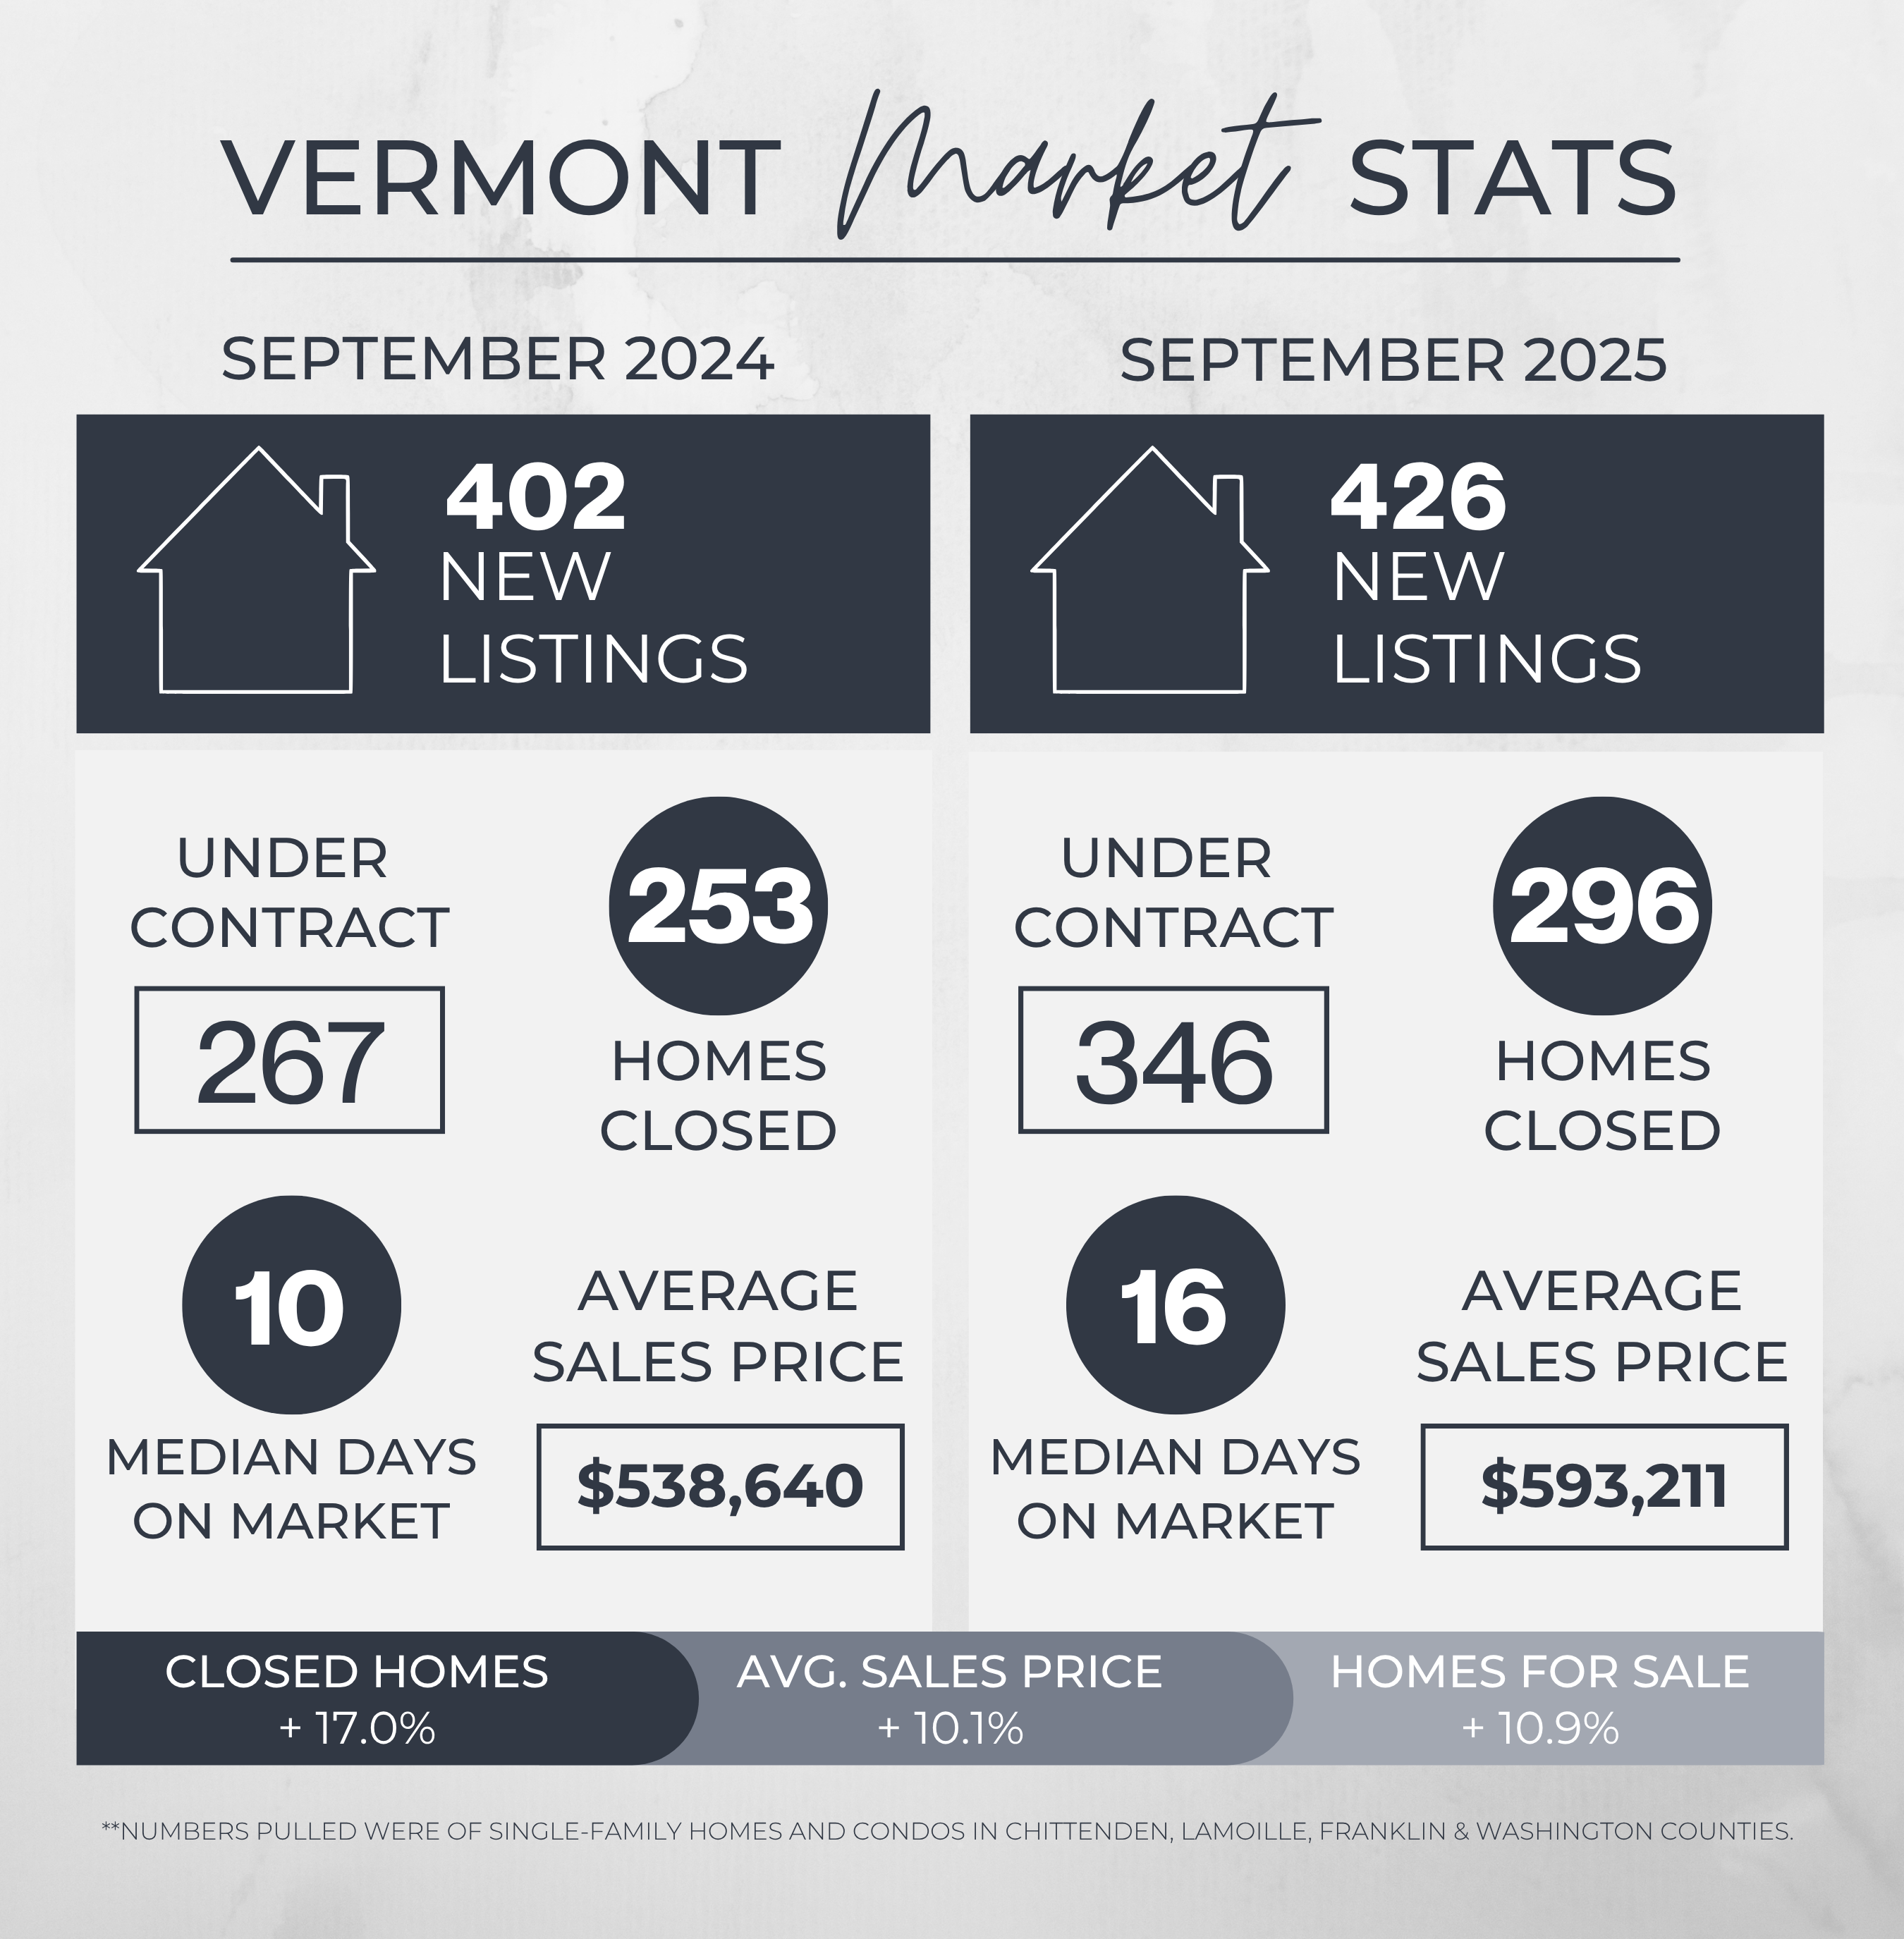
September 2025 Vermont Real Estate Market Update

 September 2025 Vermont Real Estate Market Update: A More Balanced Market Takes Shape
As we officially wrapped up the third quarter, Vermont’s real estate market continued to reflect the shifting dynamics we’ve seen over the past few months—higher inventory, a more measured pace, and growing power on the buyer side.
Homes are still selling. In fact, total sales volume was up nearly 29% compared to September 2024. But the road to closing is looking a little different than it did a year ago, with longer timelines, more contingencies, and a clear focus on pricing strategy.
Here’s what stood out in September:
Buyer Activity Stayed Strong, But Momentum Slowed
-
Total homes under contract (pending + active under contract) were up 29.6% year-over-year, a strong indicator that buyer interest hasn’t disappeared.
-
But compared to August, that number dipped slightly (-2.81%), suggesting a natural seasonal slowdown.
-
Closed sales were also up 17% year-over-year, but fell sharply from August (-17.78%), reflecting the lagging effect of summer contracts and the market’s evolving pace.
Buyers are still out there—but they’re taking their time, asking more questions, and negotiating more frequently.
Homes Are Sitting Longer Across the Board
-
Average days on market rose to 37 days—a 54% increase compared to September 2024.
-
Median days on market climbed to 16 days, up 60% year-over-year.
That means homes are no longer flying off the market within a week. For sellers, it’s important to understand that this shift isn’t necessarily negative—it’s just different. Today’s buyers are weighing their options carefully, and listings that are outdated or overpriced are sitting noticeably longer.
Prices Remain High, But List-to-Sale Ratios Are Slipping
-
Average sale price: $593,211 (up 10.1% YOY / up 3.25% from August)
-
Median sale price: $480,000 (up 11.6% YOY / down 4.0% from August)
-
List-to-sale ratio: dropped to 98.44% on average and 98.56% at the median
So while prices remain elevated compared to 2024, the number of homes selling at or above list price continues to decline. Bidding wars aren’t gone—but they’re less common, and price reductions are growing more frequent.
Price Reductions, BOMs, and Expireds Continue to Climb
This month’s contract fallout and pricing adjustments offer key insights:
-
338 price changes
-
57 homes came back on the market (BOM)
-
96 listings expired or were terminated
Each of these signals a more cautious and empowered buyer pool. Contingencies are back, inspections are being taken seriously, and buyers aren’t hesitating to walk away when things don’t line up.
On the seller side, homes that don’t show well, need updates, or are priced above what buyers see as fair are the first to get skipped over or see significant negotiation.
Luxury Sales Bounced Back Slightly—But Still Lagging
-
21 homes sold over $1M this month, up 40% from last September, but down 25% from August.
-
The highest sale closed at $6.4M, up from $3.85M a year ago.
While we saw some significant luxury closings, the volume at this price point is still lower than mid-summer, suggesting that the high end of the market remains more vulnerable to economic caution and affordability factors.
What This Means for Buyers and Sellers
This is no longer the high-speed, ultra-competitive market of 2021–2022. We’re in a more balanced—and arguably healthier—phase.
For buyers, that means more choices, more time, and more room to negotiate. You may not see big price drops, but you can often make offers with reasonable contingencies and expect a thoughtful response.
For sellers, strategy matters more than ever. Overpricing or skipping key prep steps will lead to slower sales or lower offers. But homes that are well-priced and move-in ready are still getting strong results—especially in more in-demand locations.
Want to Talk Strategy?
Whether you’re thinking of buying this fall, prepping for a spring sale, or just curious about where things stand in your area, we’re always happy to walk you through the numbers and help you understand your options.
📍 Get your free home value estimate
📍 Reach out for a personalized market update and strategy session
**The market data used in this update is from single-family homes and condos in Chittenden, Franklin, Lamoille and Washington counties.
GET IN TOUCH
|


or another way