
Categories
Buying, Selling, Vermont Market UpdatesPublished March 5, 2026
February 2026 Vermont Housing Market Update: Spring Momentum Is Building and the Contracts Prove It

February 2026 Vermont Housing Market Update: Spring Momentum Is Building, and the Contracts Prove It
February gave us one of those months where the market is doing two things at once. Inventory and under-contract activity both jumped sharply, which are strong signals that spring momentum is building. At the same time, closings fell off significantly from January, and days on market climbed again, reminding us that the pace of the market and the direction of the market are not always the same thing.
Here is what February’s numbers tell us:
The drop in total volume is a function of fewer closings this month, not lower prices. As February’s contract surge works its way to the closing table in March and April, volume should recover.
Bottom line: This month’s numbers are a much more accurate representation of the market. Buyers are negotiating, and the market is rewarding homes that feel like a clear value.
Bottom line: Luxury is still moving, but it’s selective. That 86% list-to-sale ratio on the top sale is a good reminder that at higher price points, negotiation and buyer leverage can be much more pronounced, especially when inventory is rising.
Here is what February’s numbers tell us:
Buyer Activity: Spring Demand Is Here, Even as Closings Lag
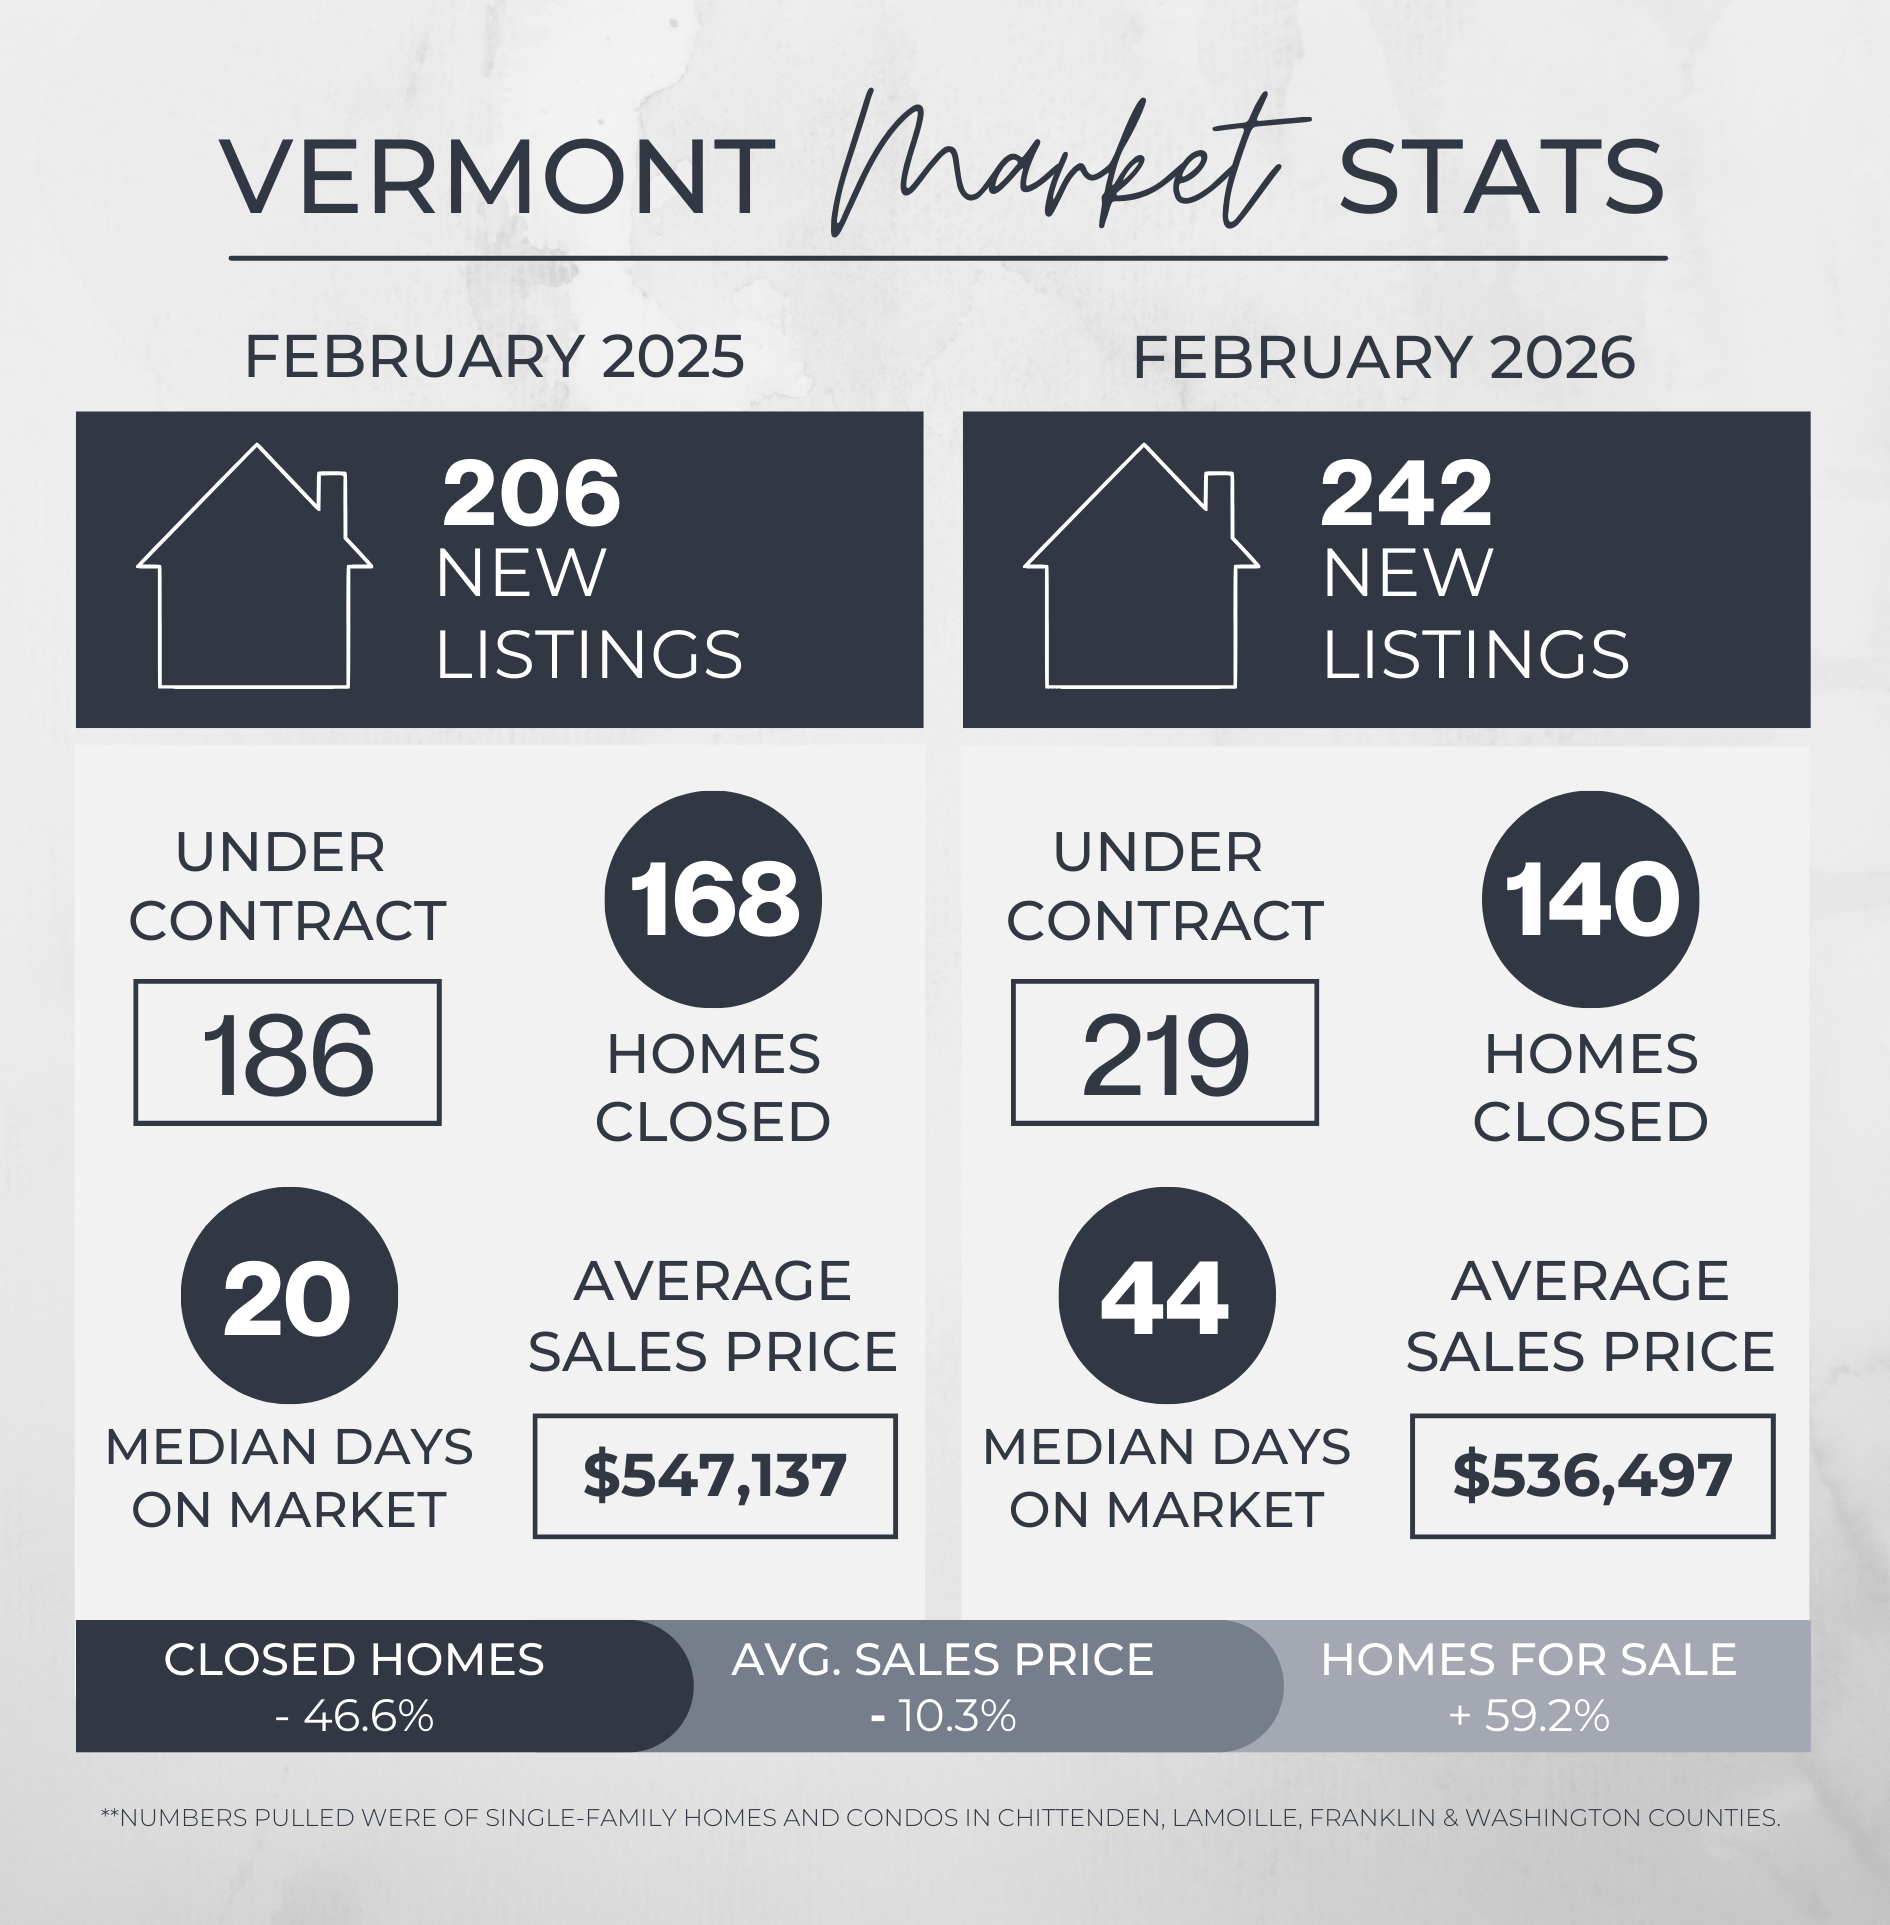
- Closed Sales: 140 (down 16.67% YoY, down 46.56% MoM)
- Total Under Contract: 219 (up 17.74% YoY, up 20.99% MoM)
Inventory + Competition: More Options and a Higher Bar for Sellers
New inventory moved dramatically in February, which is a healthy thing for the market.- New Listings: 242 (up 17.48% YoY, up 59.21% MoM)
Days on Market: A Noticeably More Deliberate Buyer
- Average DOM: 62 days (up 29.17% YoY, up 26.53% MoM)
- Median DOM: 44 days (up 120% YoY, up 83.33% MoM)
Pricing + Negotiation: Average Softened, Median Rose
February’s pricing is more straightforward than January’s luxury-skewed numbers and more representative of what most buyers and sellers are actually experiencing.- Average sold price: $536,497 (down 1.94% YoY, down 10.29% MoM)
- Median sold price: $425,250 (up 3.09% YoY, down 6.74% MoM)
- Average list-to-sale ratio: 97.28%
- Median List-to-Sale Ratio: 97.88%
- Total Volume: $75.1M (down 18.29% YoY)
The drop in total volume is a function of fewer closings this month, not lower prices. As February’s contract surge works its way to the closing table in March and April, volume should recover.
Bottom line: This month’s numbers are a much more accurate representation of the market. Buyers are negotiating, and the market is rewarding homes that feel like a clear value.
What the “Behind-the-Scenes” Numbers Are Telling Us
- Price Changes: 130 (up 5.69% MoM)
- Expired / Terminated: 65 (down 2.99% MoM)
- Back on Market: 28 (down 31.71% MoM)
Luxury Snapshot: Fewer $1M+ Closings, and More Negotiation at the Top
The luxury segment pulled back in February after a strong stretch at the end of 2025 and a headline-grabbing January.- Units Sold Over $1M: 10 (Feb '25: 15) — down 33.33% YoY, down 64.29% MoM
- Highest Sale: $3,400,000 at 86.08% of list ($3,950,000 ask)
- Feb '25 Top Sale: $3,200,000 selling at 97.71% of list
Bottom line: Luxury is still moving, but it’s selective. That 86% list-to-sale ratio on the top sale is a good reminder that at higher price points, negotiation and buyer leverage can be much more pronounced, especially when inventory is rising.
TL;DR: February 2026 at a Glance
- New Inventory jumped: Active listings were up 59% from January.
- Under-contract activity rose sharply: Total under contract was up 21% month-over-month.
- Closings fell: Closed sales dropped 46% from January.
- Median DOM doubled: year-over-year it climbed to 44 days.
- Prices held steady at the core: The average dipped slightly (down 1.94% YoY), median rose (3.09% YoY), and the list-to-sale continued to sit around 97% on average.
- Deal stability improved: Back-on-market properties dropped 31.7%, which means fewer contracts are falling apart.
What This Means for Buyers and Sellers
For Sellers: The surge in buyer contracts is good news; it shows us demand is there. But with active listings up 59% from last month, your home has real competition now. The sellers succeeding right now are the ones treating pricing and presentation as non-negotiable. As more competition enters the market this spring, move-in-ready homes will continue to command higher prices and faster sales. If your home needs TLC, remember that the right price can overcome almost any hurdle. A strategic pricing plan from the start is key to ensuring your home is positioned as the best value in its price tier.For Buyers: This data works in your favor. More inventory, longer days on market, and sellers actively adjusting prices give you more room to negotiate and time to make a thoughtful decision. The 97.28% average list-to-sale ratio confirms there is real negotiating room on most listings. However, the contract surge is a reminder that other buyers are re-engaging, too; if you find the right home, be ready to move with intention.
Looking Ahead
February delivered exactly what January's data was pointing toward: buyers re-engaging, contracts climbing, and the spring market beginning to take shape. The closing numbers will catch up over the next 60 days as February's contracts work their way to the closing table, and March and April should tell a much more complete story about where 2026 is headed.Overall, the fundamentals haven't changed—pricing and preparation are what determine outcomes right now. Everything else is timing.
Ready to take the next step?
Whether you're planning a spring listing or want to get ahead of the competition as a buyer, we'd love to help you build a strategy that works for today's market.Schedule a free strategy call with our team or start by discovering what your home is worth in the current market.
**The market data used in this update is from single-family homes and condos in Chittenden, Franklin, Lamoille and Washington counties.
GET IN TOUCH
|


or another way