
Categories
Buying, Selling, Vermont Market UpdatesPublished February 4, 2026
January 2026 Vermont Housing Market Update: A Price Surge, Slower Pace, and Signs the Market Is Picking Up Again

January 2026 Vermont Housing Market Update: A Price Surge, Slower Pace, and Signs the Market Is Picking Up Again
January kicked off the year with a mix of familiar seasonal patterns and a few standout shifts in the data. On paper, things looked slow as homes took longer to sell and fewer properties went under contract year-over-year. However, a record-breaking jump in average sale prices revealed a market of two speeds: a luxury sector pushing records that are skewing the average, and a "middle" market that is just starting to wake up for the spring. As we’ve moved into February, the pace has already picked up dramatically in the $500,000-and-under price point, with noticeably more showings and offers on well-positioned listings.Here is what January’s numbers tell us:
Buyer Activity: Steady Numbers, Shifting Momentum
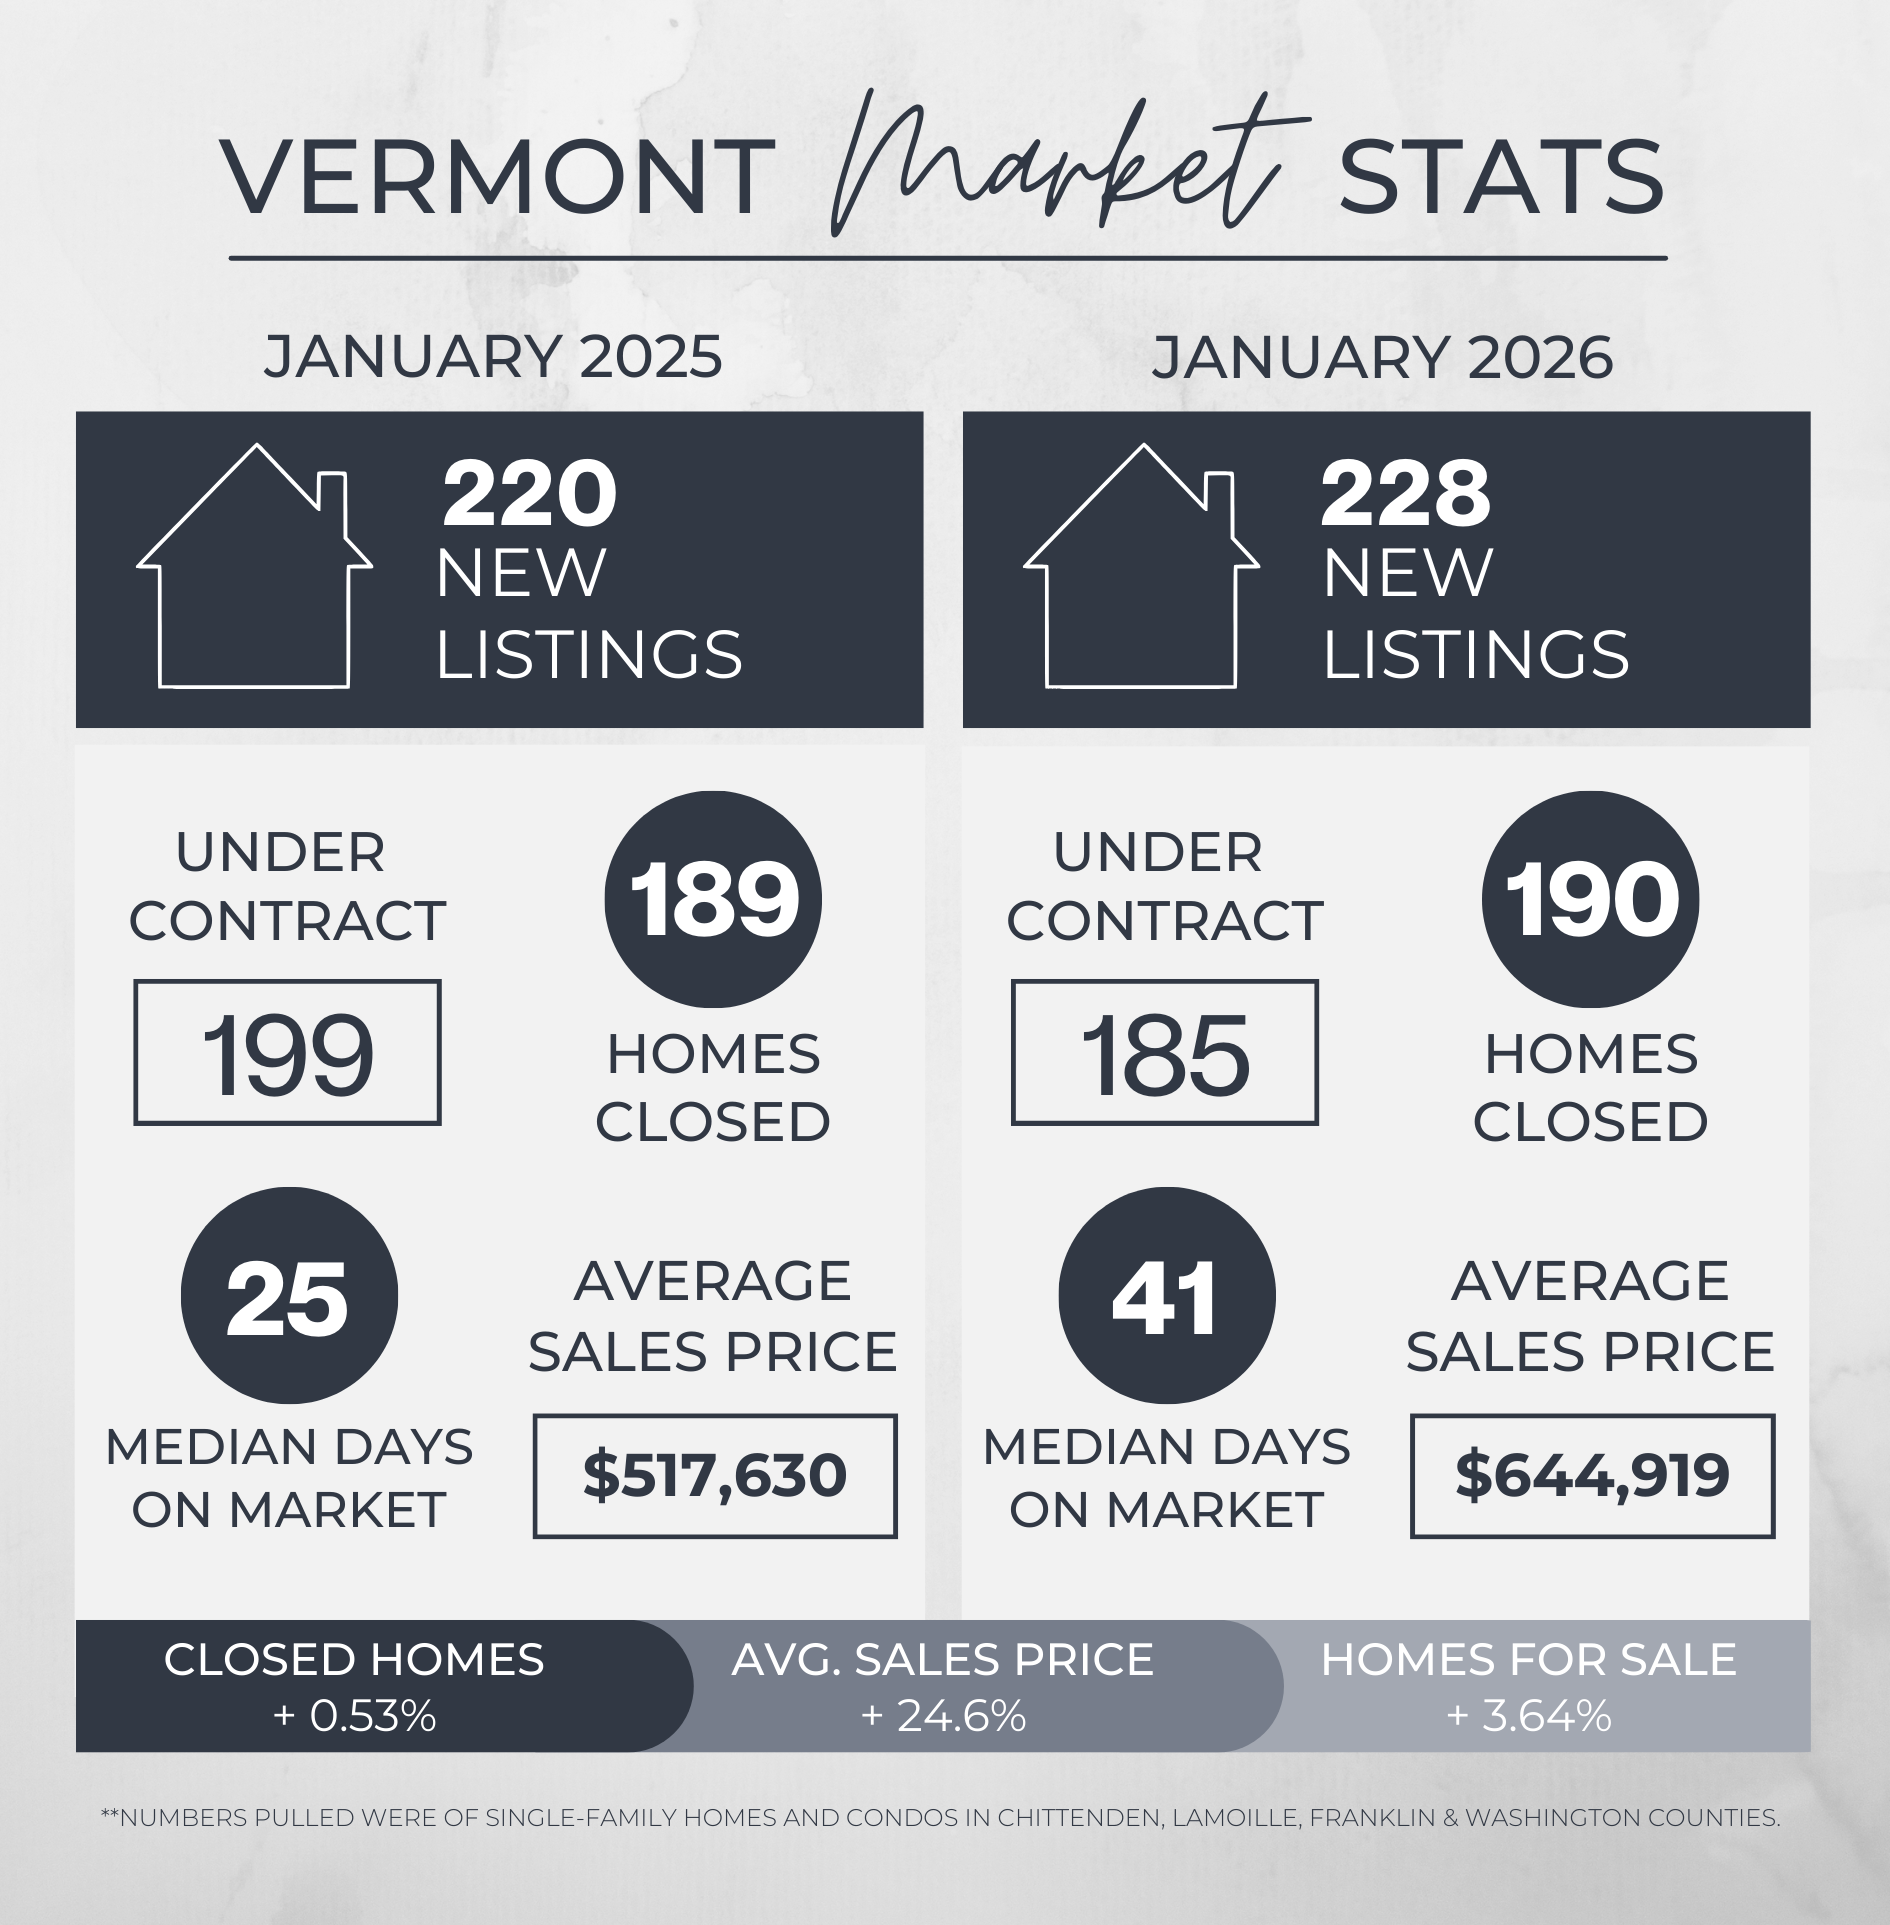
Buyer demand remained active as we moved into the new year, though the type of activity is evolving. While the number of closed sales was almost identical to last January, the volume of homes currently under contract shows a slight cooling compared to a year ago.- Total Closed Sales: 190 (+0.53% YoY, -27.48% MoM)
- Total Under Contract: 185 (-7% YoY, +2.2% MoM)
Inventory + Competition: More Options, But Still a Tight Market & Pricing Sensitivity Is Real
The inventory landscape changed significantly this month, providing more choice for buyers while adding a layer of competition for sellers as they returned to the market after the holidays.- Active Inventory: 228 listings (a 50 percent increase month-over-month and up 3.64 percent year-over-year).
Days on Market: A Sharp Jump as Buyers Take Their Time
Days on market jumped sharply year-over-year — a clear indicator that buyers are moving more slowly and taking their time to make decisions, likely due to a combination of more options, higher borrowing costs, and less urgency overall.- Average Days on Market: 61 (+38.6% YoY)
- Median Days on Market: 41 (+64% YoY)
Pricing + Negotiation: The Average Jump vs. The Median Reality
January's pricing data reveals a massive gap between the "average" and the "median," suggesting that high-end closings are currently skewing the overall picture.- Average Sold Price: $644,919 (a 24.59% jump year-over-year).
- Median Sold Price: $440,000 (a 2.2% dip year-over-year).
- List-to-Sale Ratio: The median ratio softened to 96.81%, therefore most buyers are negotiating roughly 3% below asking price.
- Total Volume Sold: $122.5M (+25.3% YoY)
What the “Behind-the-Scenes” Numbers Are Telling Us
The internal movement in January shows that sellers are actively recalibrating to find the market's new sweet spot. We’re seeing sellers adjust pricing more frequently, which usually means buyers are pushing back when value doesn’t feel clear.- Price Changes: 123 (+28.1% MoM)
- Back on Market: 41 (+17.1% MoM)
- Expired/Terminated: 67 (-37.4% MoM)
Luxury Snapshot: Fewer $1M+ Sales, Bigger Top-End Numbers
- Units Sold Over $1M: 10 (-9.1% YoY, -65% MoM)
- Highest Sale: $14,000,000, sold for 12% above List Price
What the Numbers Don’t Fully Capture Yet: Early Market Pickup for Under $500K
Here’s the biggest “real time” shift we’re seeing that January’s stats won’t fully reflect: buyer activity has ramped up quickly heading into February, particularly for homes priced $500,000 and below.That segment tends to be the most competitive and the most sensitive to rates and affordability. Over the past couple of weeks, we’ve seen more showings and more offers on well-priced listings in that mid-to-lower price range, suggesting the spring ramp-up may be starting earlier than expected in the more affordable price brackets.
Bottom Line: * Buyers under $500K: Expect more competition than January’s slower numbers suggest. Being pre-approved and ready to act is essential as things pick up.
- Sellers under $500K: If your home is priced well and shows well, it can move quickly right now, before the spring inventory surge brings more competition for buyer attention.
TL;DR: January 2026 at a Glance
- Average prices surged, but median dipped: The average sold price jumped 24.6% to $644,919, though the median price dipped slightly to $440,000. This is not as shocking as it seems at first glance, since high-end sales are skewing the average. The median is a much more accurate picture.
- New inventory grew: Active listings jumped 50% month-over-month, with 228 new listings coming on the market, giving buyers more to choose from.
- Homes taking longer to sell: The median days on market hit 41 days, up from 25 last year.
- Sellers are adjusting: Price changes are up 28% month-over-month, and expired and terminated listings dropped 37%, showing that sellers are working harder to meet buyer expectations.
- Luxury highlights: A record-breaking $14M sale headlined the month, even as the total number of $1M+ sales dipped slightly.
- Real-time shift: The $500,000-and-under market has picked up quickly with more showings and offers as we head into early February.
What This Means for Buyers and Sellers
For Sellers: The market is rewarding realistic pricing and strong presentation. As more competition enters the market this spring, move-in-ready homes will continue to command higher prices and faster sales. The 123 price changes we saw in January are a clear signal that today’s buyers are actively comparing their options and negotiating when the value isn’t obvious.We also recognize that not every homeowner is in a position to get their home as move-in ready as they’d like before listing (though we can absolutely help with this). The good news is that the right price can overcome almost any hurdle, including condition. If your home needs a little TLC, a strategic pricing plan from the start is key to a successful sale. Work with your agent to ensure your home is positioned as the best value in its price tier, regardless of condition.
For Buyers: This is your window of opportunity. With more active listings, longer days on market, and a slightly softer median sale price, you have more breathing room to negotiate than you’ve had in a while. If you can get into the market before the spring push really ramps up, even better. Just keep in mind that competition will pick up as we head deeper into the year, so being preapproved and having a clear strategy is essential to ensure you’re ready to act when the right home appears.
Looking Ahead
January brought a slower pace on paper, but early February activity suggests the spring ramp-up may be starting earlier than expected in the most active price brackets. The key theme right now is simple: strategy matters. Pricing, prep, and expectations are more important than ever.Ready to take the next step? Whether you’re ready to move or are just starting to plan, we’re here to help!
Schedule a free strategy call with our team or start by discovering what your home is worth in the current market.
**The market data used in this update is from single-family homes and condos in Chittenden, Franklin, Lamoille and Washington counties.
GET IN TOUCH

Jon Templeton
Realtor & CEO | Templeton Real Estate Group | Keller Williams Vermont


or another way