
Published April 1, 2023
March 2023 Vermont Real Estate Market Update

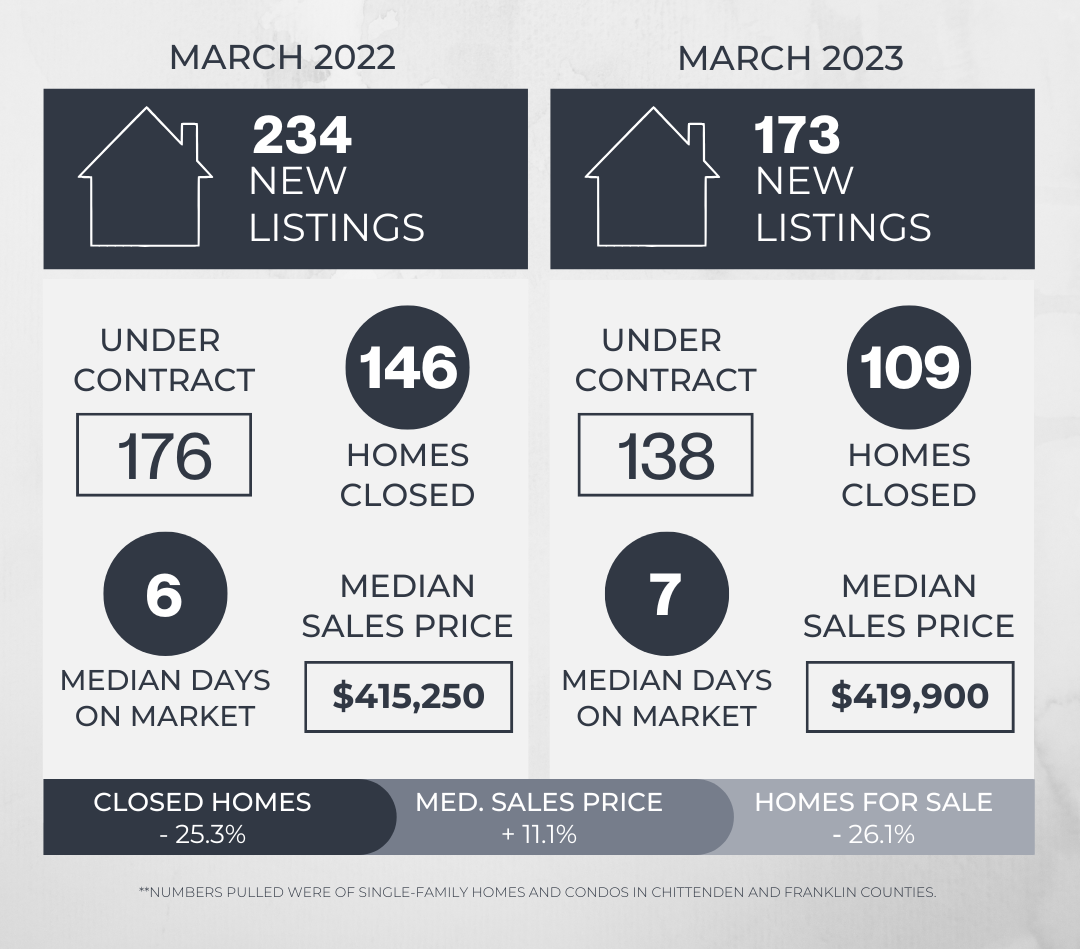

Spring is here and the March market certainly seems to be indicative of that! There was an increase in activity across the board from the relatively slow month of February, where we saw a notable decrease in the number of new listings as well as the days on market jumped to 18 (a 257% increase from January!).
Luckily March brought an increase in new listings as compared to the previous month, however, we are still down over 26% from the number of homes listed in March of 2022. And though the Median List Price remained at $399,900 year over year, buyers paid an average of 5% over the list price this year compared to only 3.8% last year.
Inventory continues to be our number one challenge as prices continue to rise, though more slowly than previously seen due to rising interest rates and overall concerns with the economy. Currently, Vermont has only 1.67 months' supply of inventory - 6 months is considered a balanced market. With such a severe lack of inventory and a new surge of buyers getting back to their searches now that spring has sprung, we will continue to see tight and competitive markets, multiple offers and heightened housing prices in many areas of the state.
And while many areas will hold strong, some areas, may not be quite so lucky. Here we've compared Q1 of '22 to '23 for the major Vermont counties so you can see how the different markets are faring in comparison to each other.

Sales are down across all counties, while prices remain up but with slowing growth. As is typical, Chittenden County continues to see strong numbers with the average buyer paying 2.4% over the list price. Lamoille County has seen consistent price growth and currently sits at a list-to-sale ratio of 104.2%. And despite the number of days on market increasing significantly, Stowe is actually seeing an increase in the number of sales as well as in the list-to-sale ratio. Franklin County also saw no change in days on market and an increase in the list-to-sale ratio with homes selling for a staggering average of 10% over the median list price.
Meanwhile, Washington and Addison counties have seen the largest decrease in list-to-sale ratio, with buyers paying an average of 1.1% under list price in Addison. And Washing and Franklin counties experienced the largest decline in number of sales. Some of the more rural markets not listed above have seen even more change in the way of slowing price growth and limited activity with increasing days on market.
--
Want to know more about the current market and where it's headed? Get in touch!
Sales are down across all counties, while prices remain up but with slowing growth. As is typical, Chittenden County continues to see strong numbers with the average buyer paying 2.4% over the list price. Lamoille County has seen consistent price growth and currently sits at a list-to-sale ratio of 104.2%. And despite the number of days on market increasing significantly, Stowe is actually seeing an increase in the number of sales as well as in the list-to-sale ratio. Franklin County also saw no change in days on market and an increase in the list-to-sale ratio with homes selling for a staggering average of 10% over the median list price.
Meanwhile, Washington and Addison counties have seen the largest decrease in list-to-sale ratio, with buyers paying an average of 1.1% under list price in Addison. And Washing and Franklin counties experienced the largest decline in number of sales. Some of the more rural markets not listed above have seen even more change in the way of slowing price growth and limited activity with increasing days on market.
GET IN TOUCH

Jon Templeton
Realtor & CEO | Templeton Real Estate Group | Keller Williams Vermont


or another way