
Categories
Buying, Selling, Vermont Market UpdatesPublished April 9, 2026
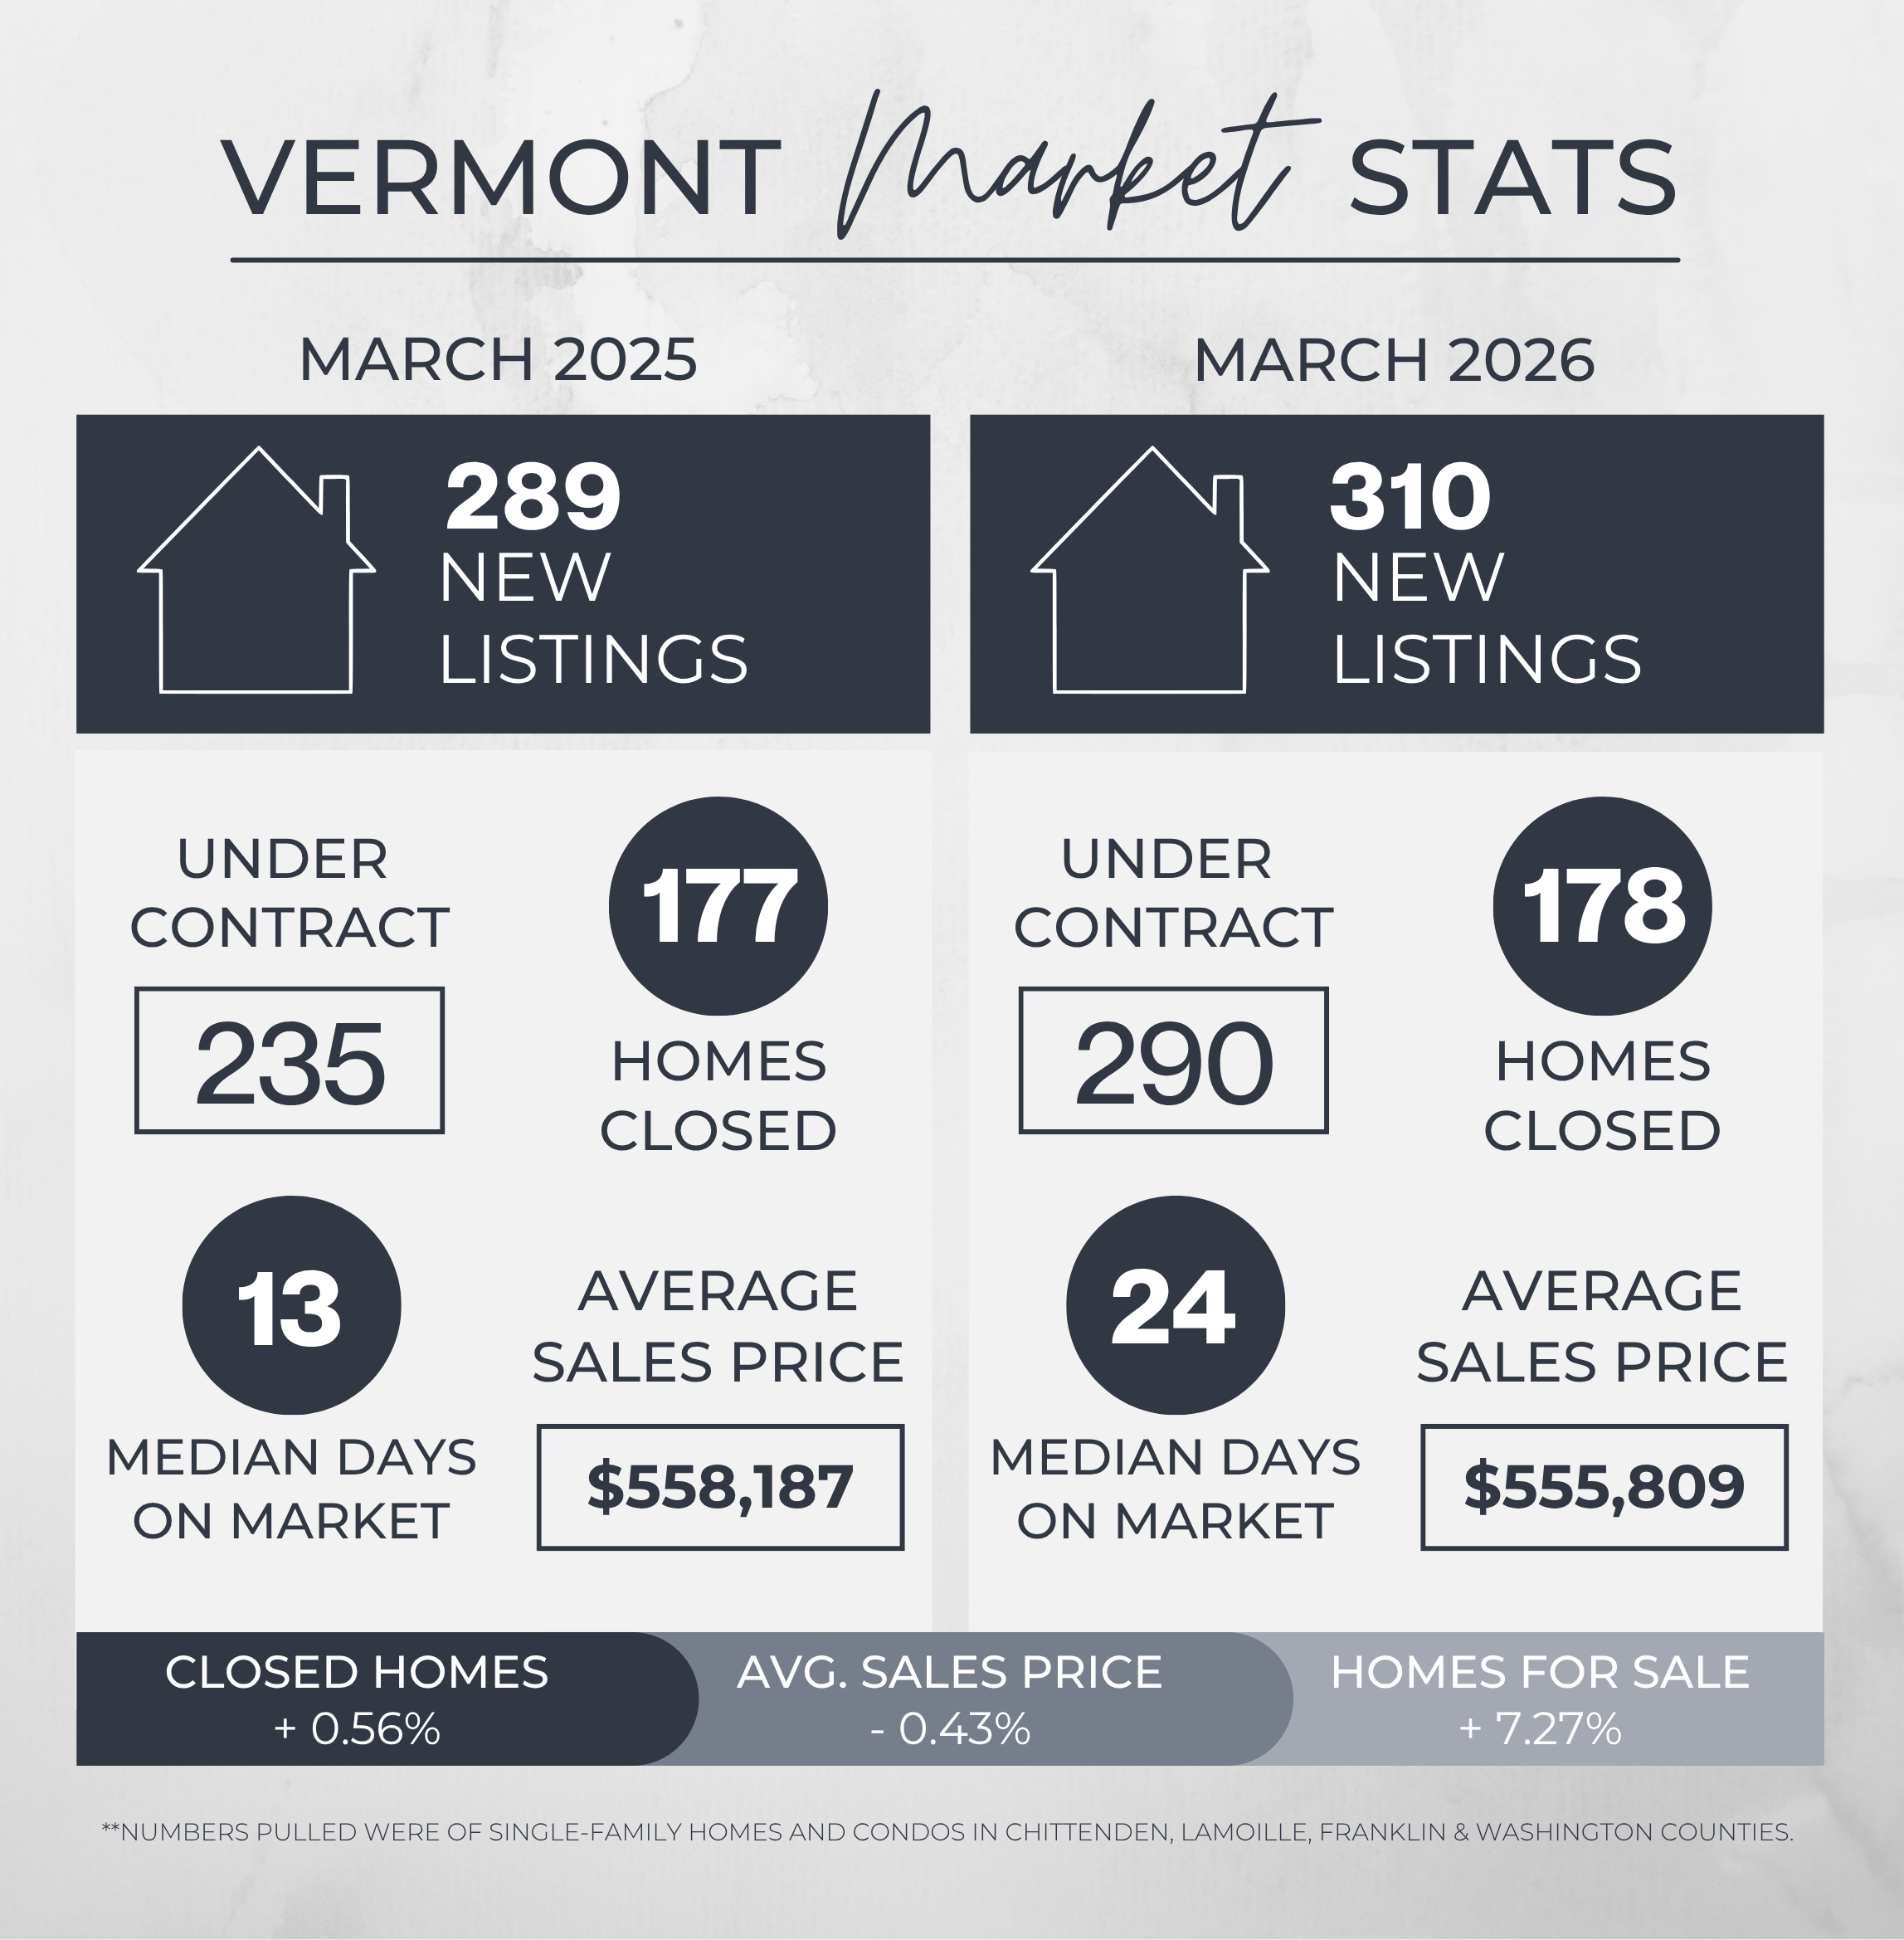
March 2026 Vermont Housing Market Update: More Listings, More Contracts, and the Spring Market Taking Shape

March 2026 Vermont Housing Market Update: More Listings, More Contracts, and the Spring Market Taking Shape
March delivered on what February’s contract activity was hinting at. Under-contract numbers surged, closings returned to last year’s pace, and total volume matched March 2025 almost exactly. After a winter where closings slowed and days on market climbed, March is a clear signal that the spring market is here. However, the pace is still slower than last year, with days on market remaining elevated and buyers negotiating a bit more than they were a year ago. Strong demand and growing supply are meeting in the middle, and the result is a market that feels balanced.Here’s what March’s numbers tell us:
Buyer Activity: The Spring Surge Is Real
- Closed Sales: 178 (up 0.56% YoY, up 27.14% MoM)
- Total Under Contract: 290 (up 23.40% YoY, up 32.42% MoM)
Inventory and Competition: Supply Is Growing, and It’s Keeping Prices in Check
- New Listings: 310 (up 7.27% YoY, up 28.10% MoM)
Days on Market: The Spring Pace Is Back, but Not for Every Listing
- Average DOM: 62 (up 67.57% YoY, flat MoM)
- Median DOM: 24 (up 84.62% YoY, down 45.45% MoM)
Bottom line: The market is moving quickly for the right listings and slowly for the wrong ones. If your home is priced well and shows well, the spring pace is working in your favor. If it isn’t, the average DOM tells you exactly what you’re up against.
Pricing and Negotiation: Stable, Not Surging
- Average Sold Price: $555,809 (down 0.43% YoY, up 3.60% MoM)
- Median Sold Price: $458,750 (down 0.27% YoY, up 7.88% MoM)
- Avg List-to-Sale Ratio: 98.48% (Mar ’25: 99.54%)
- Median List-to-Sale Ratio: 97.81% (Mar ’25: 98.08%)
- Total Volume: $98.9M (up 0.14% YoY, up 31.72% MoM)
The list-to-sale ratio softened slightly from last year, which generally means buyers are negotiating around 2% below asking on average.
Bottom line: Prices are steady. Sellers aren't easily conceding on pricing, and buyers are not wildly overpaying. It’s competitive, but far more predictable than the past few years have been.
What the Behind-the-Scenes Numbers Are Telling Us
- Price Changes: 119 (down 8.46% MoM)
- Back on Market: 35 (up 25.00% MoM)
- Expired/Terminated: 60 (down 7.69% MoM)
Back on market is worth watching. It can simply reflect more overall deals happening, but it can also be a sign of buyers using inspections and contingencies more actively, which is consistent with a more balanced market.
Bottom line: Pricing and prep are still the levers that drive results. When those are dialed in, homes move. When they’re not, buyers take their time.
Luxury Snapshot: Volume Modest, Negotiation Still Real
- Units Sold Over $1M: 11 (Down 15.38% YoY, up 10.00% MoM)
- Highest Sale: $3,150,000 at 92.65% of list (ask $3,400,000)
- Mar ’25 Top Sale: $2,900,000 at 100% of list
Bottom line: The top of the market is active, but buyers are price sensitive and strategic.
TL;DR: March 2026 at a Glance
- The spring market arrived: 290 homes under contract, up 23.4% YoY (strongest in months).
- New inventory came quickly: Nnew listings up 28.1% MoM, giving buyers more to compare.
- Closings returned to last year’s pace: 178 closed sales, essentially flat YoY and up 27% from February.
- Median DOM snapped back to 24 days: Down sharply from February’s 44, but the overall market pace is still slower than last year with the average DOM at 62 days, up 67.6% YoY.
- Prices are stable: Average and median sold prices both within 0.5% of last March.
- Sellers are pricing smarter: Fewer price reductions and fewer expirations suggest better positioning than earlier in the year.
- Negotiation is real: List-to-sale ratios dipped vs. last March. Buyers are pushing back when value isn't clear.
What This Means for Buyers and Sellers
For sellers: The spring market is here and buyers are active. The under-contract number proves it. But inventory is growing alongside demand, which means your home has real competition now. The listings winning today are the ones priced correctly from day one and showing well. Fewer price reductions this month tells you the sellers who did that work up front are being rewarded. Work with your agent on a strategy grounded in current comps, not last year’s numbers, and give buyers a clear reason to choose your home over the growing list of alternatives.For buyers: You have more options than you did even a month ago and longer decision timelines give you more room to negotiate and time to make a thoughtful choice. The 98.48% average list-to-sale ratio confirms there’s room to work with on many listings. Just know that under-contract activity is rising quickly, and the drop in median DOM shows the best homes still move fast. Being prepared and decisive will matter most when the right listing hits.
Looking Ahead
March confirmed what the data has been building toward: a spring market defined by balance rather than frenzy. Strong demand, growing supply, stable prices, and faster movement for well-priced homes. April will tell us whether that balance holds as more inventory enters the market and buyer competition increases.The fundamentals are clear. Pricing and preparation are still the variables that determine outcomes. Everything else is timing.
Ready to make your move this spring? Whether you’re listing or looking, we’d love to help you build a strategy for today’s market.
Get your current home value with our free tool.
Reach out to us to talk through timing, pricing, and next steps.
Reach out to us to talk through timing, pricing, and next steps.
**The market data used in this update is from single-family homes and condos in Chittenden, Franklin, Lamoille and Washington counties.
GET IN TOUCH

Jon Templeton
Realtor & CEO | Templeton Real Estate Group | Keller Williams Vermont


or another way