
Categories
Buying, Selling, Vermont Market UpdatesPublished December 3, 2025
November 2025 Market Update: Slowing Down, but Still Finishing Strong

As we head into the final stretch of the year, the Vermont real estate market stats are finally reflecting the cooling many agents and buyers have been feeling for weeks. Activity dropped sharply in November across pending contracts, closed sales, and new listings—confirming that the seasonal slowdown is here.
But zoom out, and the story looks a bit different: Year-to-date, the market is still ahead of where we were in 2024, with higher total sales, higher prices, and greater overall volume.
Here’s what the November data is telling us:
📊 Month-Over-Month & Year-Over-Year Trends Show Real Softening
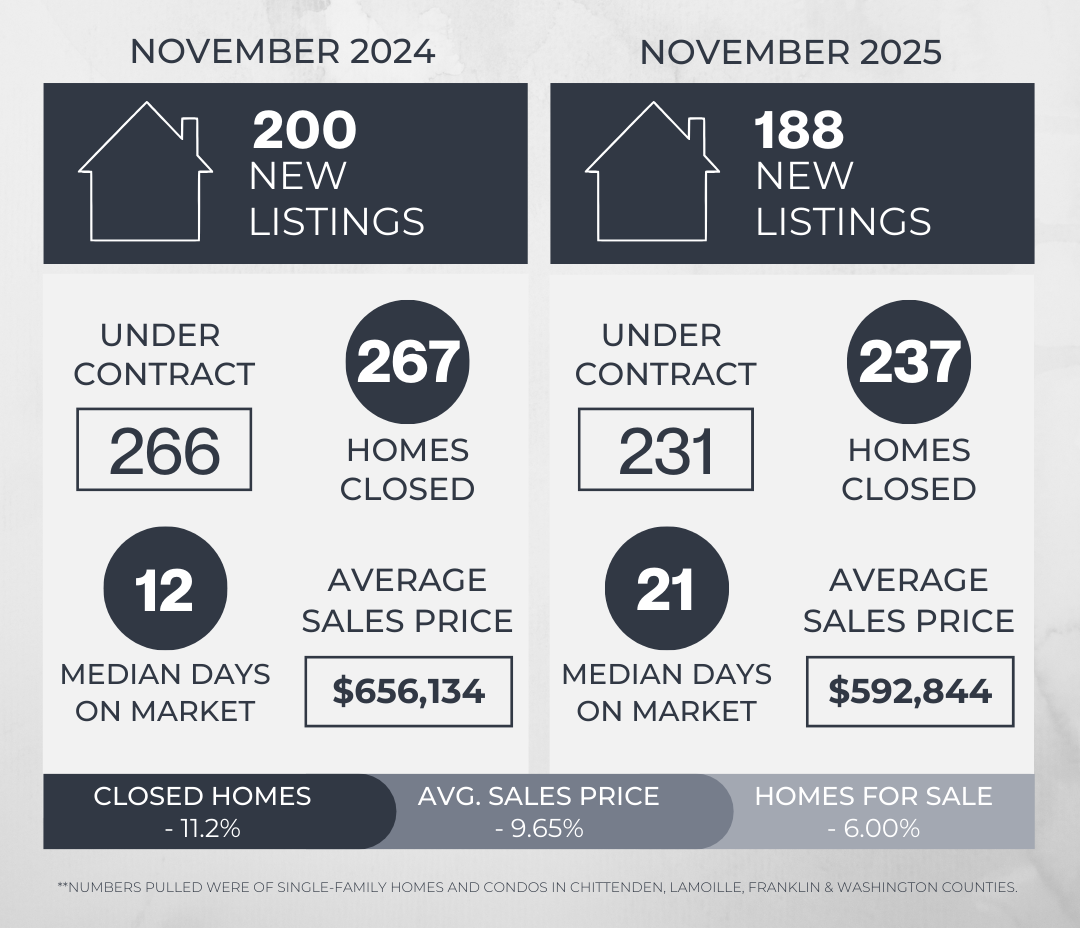
- Closed sales: 237 in Nov 2025 (down 11.2% YoY and 39% from October)
- Homes under contract: 231 total (down 13.2% YoY, and 27.4% MoM)
- Active listings: Down 6% YoY, but dropped 52% from October, likely due to sellers pulling listings for the holidays
- Average days on market: 45 days (up 50% YoY)
- Median days on market: 21 days (up 75% YoY)
Even though buyer activity has slowed, homes are sitting longer, and we’re seeing more negotiation power shift back to buyers, the year as a whole still points to strong underlying demand.
💰 Prices Have Dipped—But Not Dramatically
- Average sale price: $592,844 (down 9.7% YoY, but up slightly from October)
- Median sale price: $469,000 (down 1.3% YoY and 3.3% MoM)
- List-to-sale ratio: Dropped to 97.4% for average-priced homes and 98.7% for median-priced homes—showing sellers are negotiating more
This softening is typical for late fall and winter in Vermont. Price reductions are common as demand tapers and sellers who need to move are more willing to adjust.
📉 Price Drops, BOMs, and Expireds Are Telling the Real Story
- 181 price changes (down 44% from October)
- 44 homes came back on market
- 93 listings expired or were terminated
These numbers confirm that price sensitivity is real. The market has become more selective, and while sellers are still finding success, it requires a sharp pricing strategy, strong presentation, and patience.
🏁 Zooming Out: 2025 Is Still Ahead of 2024
Despite the slower November, year-to-date performance still paints a picture of growth:
- Total sales: 2,978 (📈 up 8.2% from 2,752 in 2024)
- Total sales volume: $1,696,294,976 (📈 up 10.9% from $1,529,944,079)
- Average sale price: $569,608 (📈 up 2.5% from $555,938)
- Median sale price: $480,000 (📈 up 4.9% from $457,750)
So yes, the pace has shifted, but the trajectory remains positive overall. Buyers are gaining more leverage, and strategic sellers are still making moves successfully.Despite the slower November, year-to-date performance still paints a picture of growth:
🧐 What This Means for You
The market has certainly cooled—but it’s not a downturn, it’s a rebalancing. We’re seeing fewer rushed decisions, more thoughtful negotiation, and a return to a healthier, more sustainable pace. It’s a shift that’s creating better conditions for well-prepared buyers and realistic sellers alike.
- If you're buying, now may be a great time to act, especially if you're hoping to avoid intense competition or find sellers more open to negotiation.
- If you're selling, thoughtful prep and pricing are more important than ever—but serious buyers are still very much in the market.
Need a Strategy for 2026?
Whether you’re prepping for a spring move or weighing your options for the year ahead, we’re here to help you make a smart, informed plan.
👉 Find out what your home is worth
👉 Schedule a free strategy call
**The market data used in this update is from single-family homes and condos in Chittenden, Franklin, Lamoille and Washington counties.
GET IN TOUCH

Jon Templeton
Realtor & CEO | Templeton Real Estate Group | Keller Williams Vermont


or another way